P2 : Plot Graph
linspace Cmd :

Now how to add labels and title to graph.
x=linspace(0,2*pi,100);
y=sin(x);
plot(x,y)
xlabel('Angle in Radian');
ylabel('Sin');
title('Sin Wave');
legend('Sin');
Output
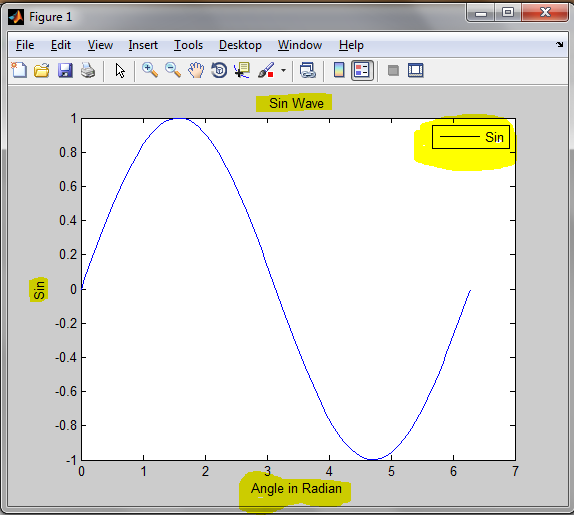 You can see highlighted change in previous and this output.
So what are the cmd for the title , for x-axis label , for y-axis label.
xlabel('Angle in Radian'); for labeling at x axis.
ylabel('Sin'); for labeling at y axis.
title('Sin Wave'); for title at top.
Now How to plot two waves like sin and cos wave in same graph:
x=linspace(0,2*pi,100);
y=sin(x);
z=cos(x);
plot(x,y,x,z)
xlabel('Angle in Radian');
ylabel('Sin and cos');
title('Sin And Cos Wave');
legend('Sin','cos');
Output
 Here in this output window you can see there are two waves. Green for cos and blue for sin waves. As you can see mentioned in corner of the graph.
So how we plot two equation in one graph.
By using plot(x,y,x,z).
Here y with respect to x and z with respect to x.
How to change color or of wave:
x=linspace(0,2*pi,50);
y=sin(x);
z=cos(x);
plot(x,y,'r+',x,z,'r*')
xlabel('Angle in Radian');
ylabel('Sin and cos');
title('Sin And Cos Wave');
legend('Sin','cos');
Output :
 Here you see differ between previous output and this output window.
So how you can do this change.
By using plot(x,y,'r+',x,z,'r*')
'r+' for sin wave here r is for red color and + is for wave using + symbol and 'r*' for cos wave r for red and * for wave in * symbol. As you can see this in corner.
Now how to draw two graphs in same window:
x=linspace(0,2*pi,50);
y=sin(x);
z=cos(x);
subplot(1,2,1);plot(x,y,'r+')
xlabel('Angle in Radian');
ylabel('Sin');
title('Sin Wave');
legend('Sin');
subplot(1,2,2);plot(x,z,'r-')
xlabel('Angle in Radian');
ylabel('Sin and cos');
title( 'Cos Wave');
legend('cos');

>> x=linspace(0,10,100);
linspace(a,b,n);
where a = start point
b = final point
n = number of point you want to divide range of a and b.
Example : >> x=linspace(0,10,10)
x =
0 1.1111 2.2222 3.3333 4.4444 5.5556 6.6667 7.7778 8.8889 10.0000
Plot Circle Using MATLAB :
>> theta=linspace(0,10,100);
>>r=10;
>> y=r*sin(theta);
>> x=r*cos(theta);
>> plot(x,y)
Output will be :
Now in this 4 line code we have theta having value 0 to 10 with 100 points. Radius r = 10. As we know that equation of circle is x2
+ y2 = r2 or x = r*cos(theta) and y = r*sin(theta). so we use x = r*cos(theta) and y = r*sin(theta) where r = 10. Now using plot cmd we draw x and y using plot(x,y) and hit enter.
We were done this work in command window. But we can do this using scrip file also. So for using scrip file with extension *.m we can plot graphs.
Steps to create script file:
Step 1 : Click New or Ctrl + N or goto File > New.
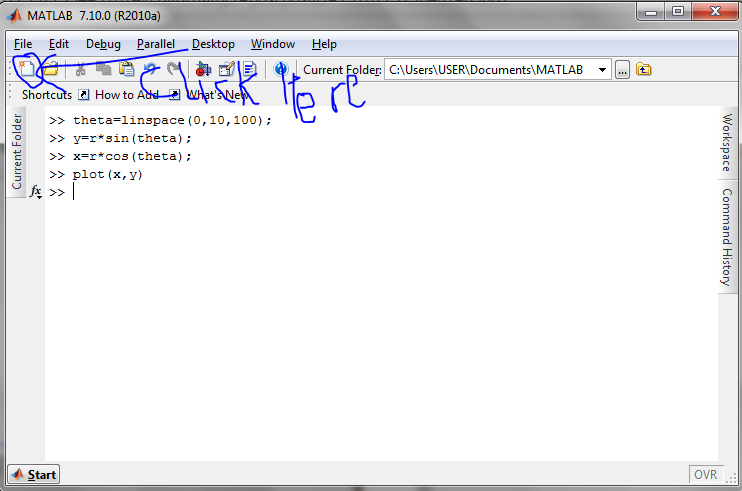 After that you will see a Pop-up window.
That is editor window.

Now here you can perform your work.
Now place your cmd here and press F5 for run this program.
Program for sin graph :
x=linspace(0,2*pi,100);
y=sin(x);
plot(x,y)
press F5 to run this code.
Output:

We were done this work in command window. But we can do this using scrip file also. So for using scrip file with extension *.m we can plot graphs.
Steps to create script file:
Step 1 : Click New or Ctrl + N or goto File > New.
That is editor window.
Now here you can perform your work.
Now place your cmd here and press F5 for run this program.
Program for sin graph :
x=linspace(0,2*pi,100);
y=sin(x);
plot(x,y)
press F5 to run this code.
Output:
Now how to add labels and title to graph.
x=linspace(0,2*pi,100);
y=sin(x);
plot(x,y)
xlabel('Angle in Radian');
ylabel('Sin');
title('Sin Wave');
legend('Sin');
Output
So what are the cmd for the title , for x-axis label , for y-axis label.
xlabel('Angle in Radian'); for labeling at x axis.
ylabel('Sin'); for labeling at y axis.
title('Sin Wave'); for title at top.
Now How to plot two waves like sin and cos wave in same graph:
x=linspace(0,2*pi,100);
y=sin(x);
z=cos(x);
plot(x,y,x,z)
xlabel('Angle in Radian');
ylabel('Sin and cos');
title('Sin And Cos Wave');
legend('Sin','cos');
Output
So how we plot two equation in one graph.
By using plot(x,y,x,z).
Here y with respect to x and z with respect to x.
How to change color or of wave:
x=linspace(0,2*pi,50);
y=sin(x);
z=cos(x);
plot(x,y,'r+',x,z,'r*')
xlabel('Angle in Radian');
ylabel('Sin and cos');
title('Sin And Cos Wave');
legend('Sin','cos');
Output :
So how you can do this change.
By using plot(x,y,'r+',x,z,'r*')
'r+' for sin wave here r is for red color and + is for wave using + symbol and 'r*' for cos wave r for red and * for wave in * symbol. As you can see this in corner.
Now how to draw two graphs in same window:
x=linspace(0,2*pi,50);
y=sin(x);
z=cos(x);
subplot(1,2,1);plot(x,y,'r+')
xlabel('Angle in Radian');
ylabel('Sin');
title('Sin Wave');
legend('Sin');
subplot(1,2,2);plot(x,z,'r-')
xlabel('Angle in Radian');
ylabel('Sin and cos');
title( 'Cos Wave');
legend('cos');
Here you can see two different sin and cos waves in different graphs but in same window.
Left one for sin and right one is for cos.
So how we are doing this?
By using subplot(1,2,1);plot(x,y,'r+');
Here in subplot we can divide one window in different different graphs , like subplot(a,b,c) where a for number of rows, b for number of columns and c for in which box you want plot.
then place your plot(x,y) cmd.
To under what will be the value of c in subplot cmd. We use c=1 to plot sin and c=2 to plot cos.
